funModeling: New site, logo and version 🚀
Hi there!
{tl;dr} Website, here ✅
In case you don't know funModeling is the package I've been developing during the last years.
It's focused on exploratory data analysis, data preparation and the evaluation of models.
News
Yesterday I published the latest version which fixes one of the plots in cross_plot. But that's not as funny as the announcement of its new logo!
Also... I added the coord_plot, useful when we are profiling any clustering model:
coord_plot(data=mtcars2, group_var="cluster", group_func=median, print_table=TRUE)
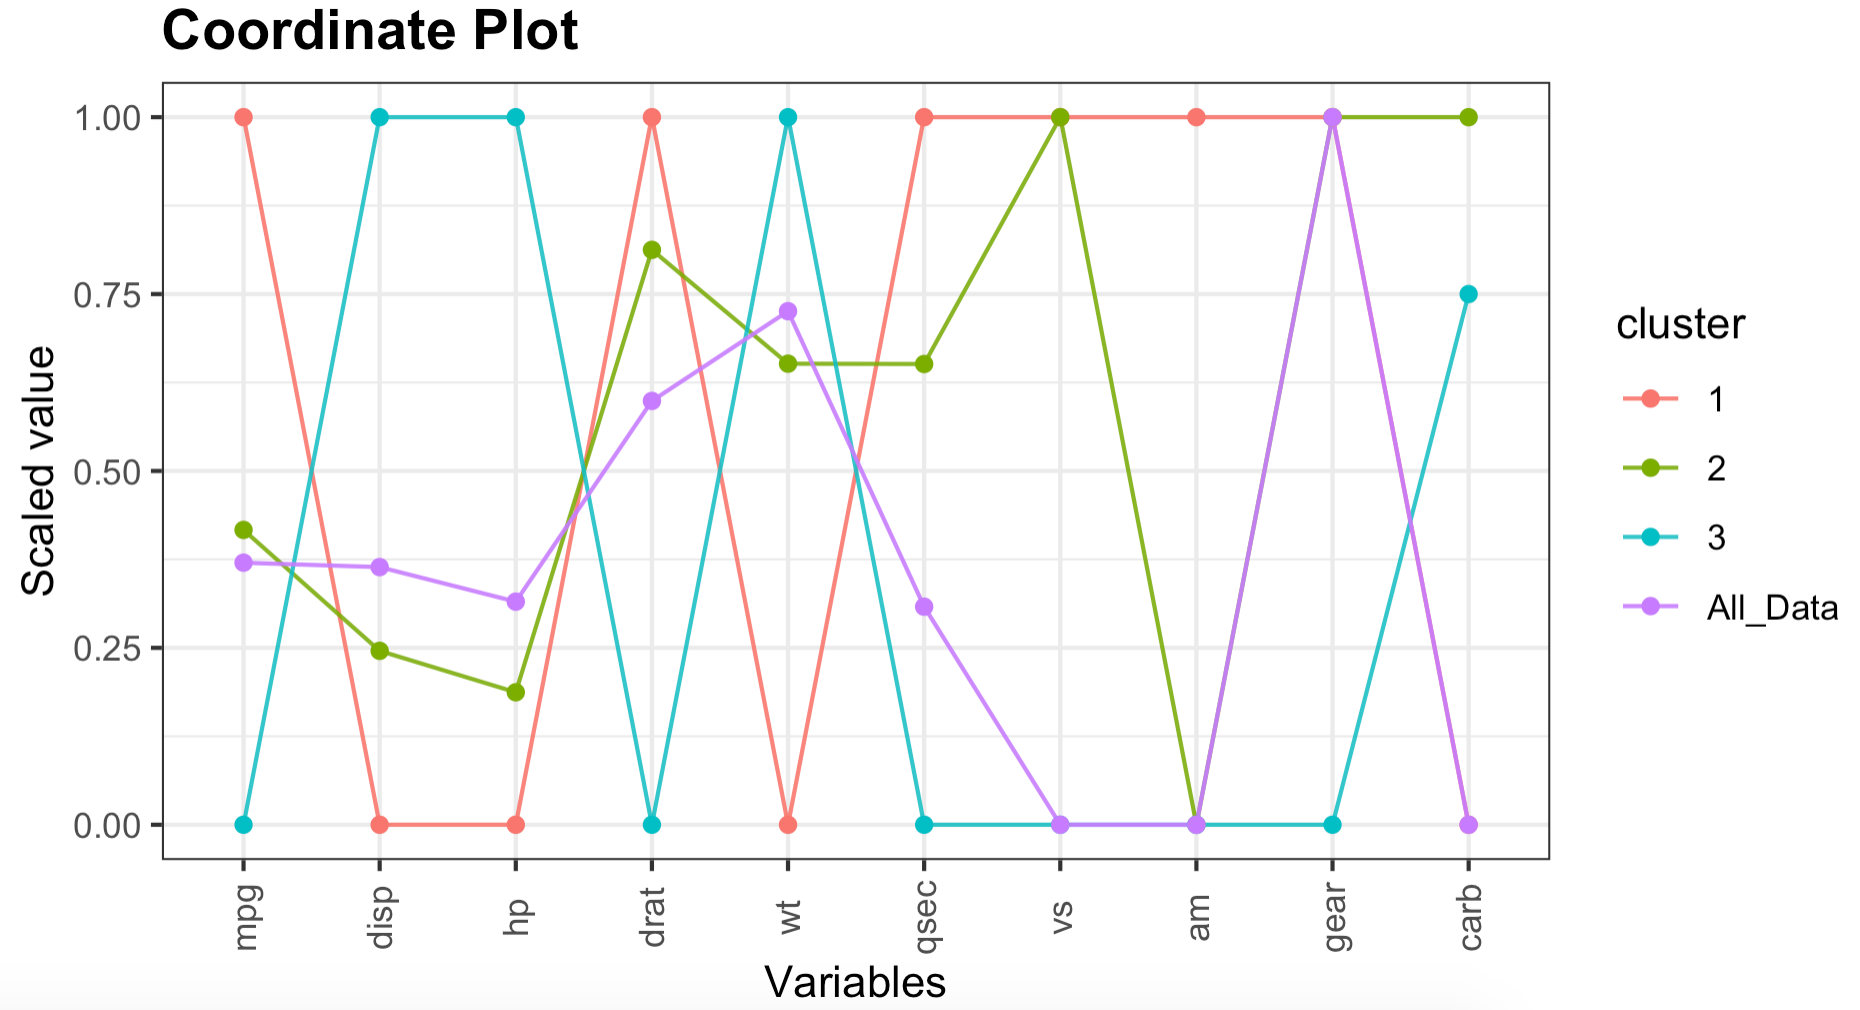
You can choose the summarization function (mean by default). Yeah... no more outlier biases in the mean, long live the percentiles!
Oh... and coord_plot produces, at the same time, a table with the results:
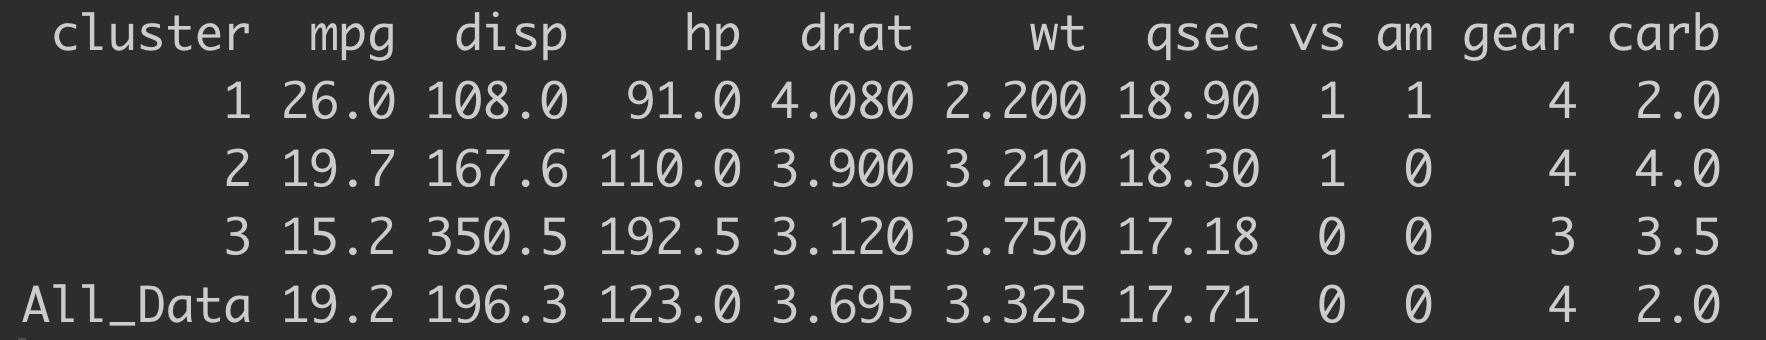

And it shows the underlying funModeling philosophy: little code, graphics and a table with results (easier to operate 🦾).
Blog posts based on funModeling:
- Exploratory Data Analysis in R (introduction)
- Automatic data types checking in predictive models
- Fast data exploration for predictive modeling
- New discretization method: Recursive information gain ratio maximization
Official page
funModelingofficial webpage- Check the vignette here.
Learn Data Science
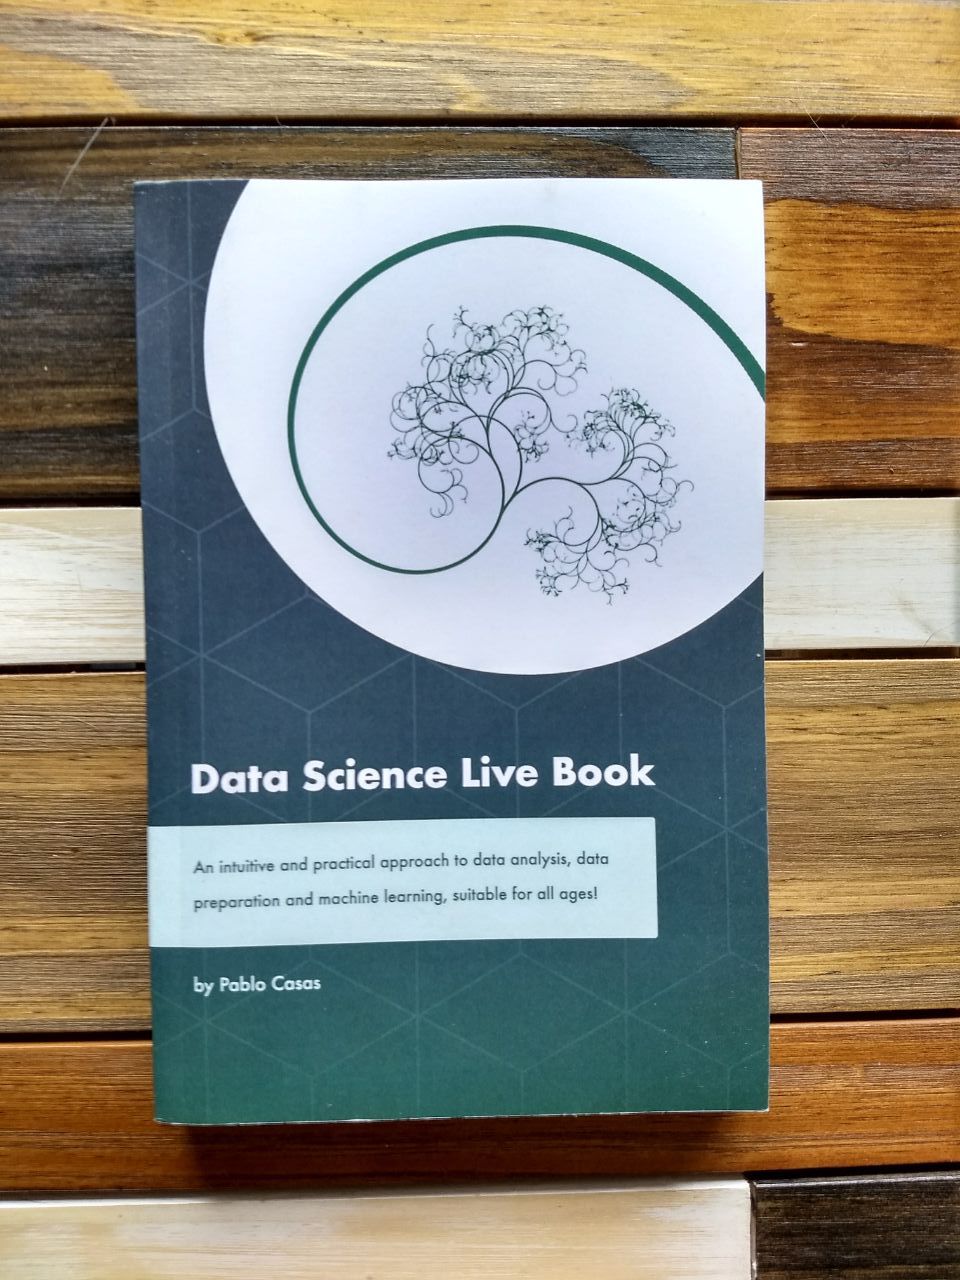
You can learn and apply more functions using the Data Science Live Book. And buy a digital copy (name your price), here.
Speak Spanish? Want to study #ML? 👉 https://escueladedatosvivos.ai
Do you use funModeling for teaching? Please contact me I want to know more :)
That's all for now!